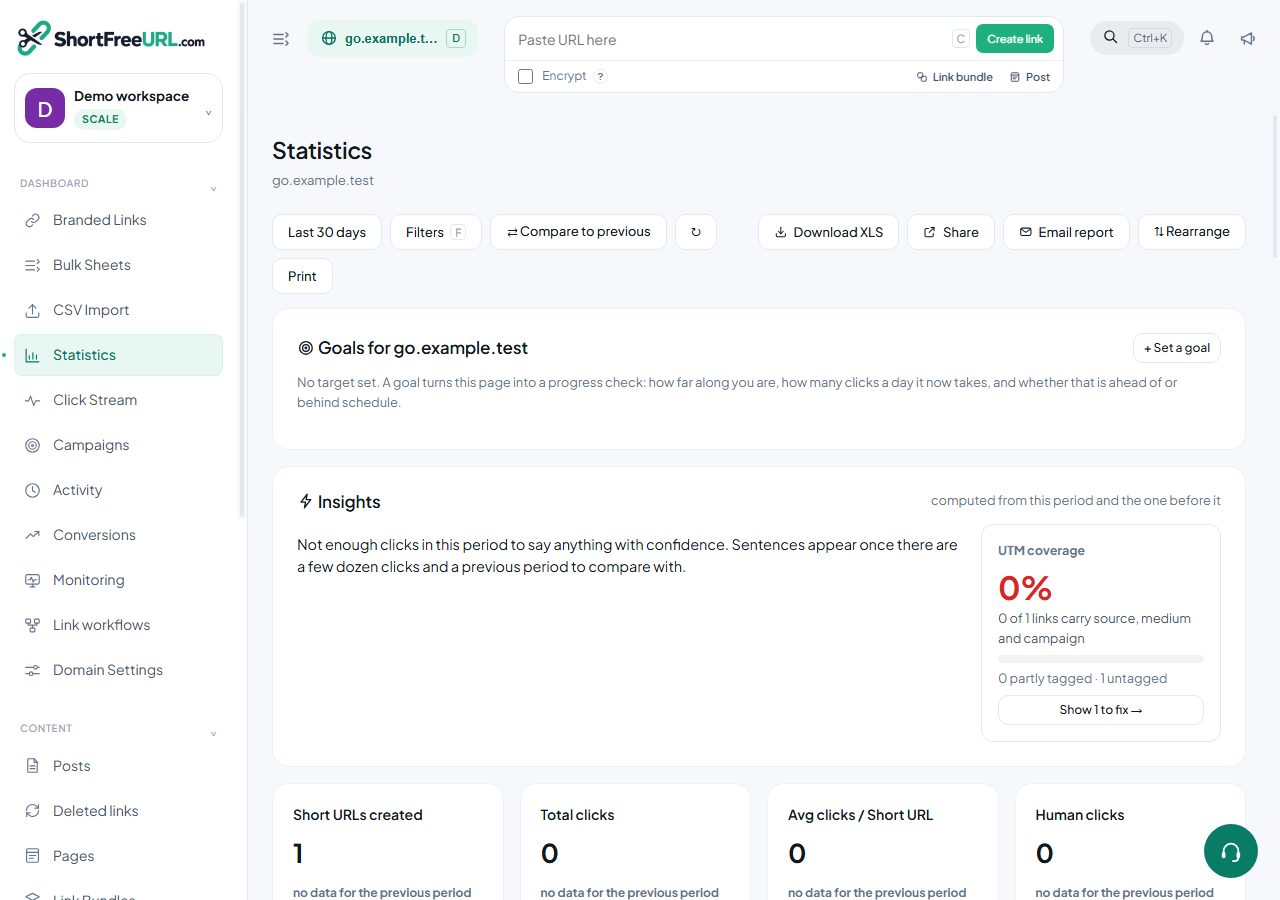
The click stream is the raw log behind every chart — one row per request, newest first, 100 rows a page. When a number on the dashboard looks wrong, this is where you find out why.
What is recorded
Each click carries far more than a timestamp:
- Identity — a click ID, the link and domain, the path, the destination actually served, and the HTTP status returned.
- Classification — human or bot, and the detected bot name.
- Location — country, country name, region, city, postal code, latitude and longitude, timezone, continent, and the source the geo data came from.
- Network — IP (unless the domain hides it), ASN, network name, and whether the address looks like a proxy.
- Client — browser and version, OS and version, device type, user agent, primary language, and viewport when the browser sends the hint.
- Traffic — referrer, referrer host and path, social network, search engine and search term, and the five UTM values.
- Flags — QR scan, A/B variation served.
Choose which of these appear as columns from the column menu; the choice is grouped by category and remembered.
Live tail
Live tail refreshes the top of the stream every five seconds. It is the fastest way to confirm a link works after publishing: post it, watch the row arrive, check the destination column is what you expected.
New in September 2026 (Starter and above)
- Live mode — new clicks are added to the top every few seconds and highlighted; it pauses while the tab is hidden.
- Filter bar — country, device, browser, operating system, traffic source, one link, people or bots, a date range and flagged-only. The filters are kept in the address, so a filtered view can be bookmarked.
- How it was handled — each click shows the rule that chose its destination: default, time & language, referrer, returning visitor, geo, mobile, A/B or a bot rule. Clicks from before 24 September 2026 show "Not recorded".
- Visitor journeys — the same visitor's other clicks across your links within seven days, grouped into sessions. Not available when the domain hides visitor IPs.
- Flags — why a click looks suspicious: bot, fake crawler, proxy or VPN, no browser identification, or blocked.
- Full CSV export — every filtered click, up to 100,000 rows, with traffic source, route and flags columns.
Filters and export
The same filter dialog as the statistics page applies here — date range, human or bot, country, city, browser, device, referrer, UTM values, folder, tag, QR only. Export the filtered stream as CSV, up to 1,000 rows per download.
Inspecting a single click
Each row opens a detail view for that click ID, showing everything recorded, including the click IDs forwarded from ad platforms (gclid, fbclid, ttclid and the rest) and whether a conversion has been attributed to it.
Retention
Each plan keeps click data for a bounded period that grows with the plan; Scale keeps it indefinitely. If you need the raw stream in a warehouse, the daily S3 export writes one newline-delimited JSON file per day into your own bucket, which is the right tool at that volume — webhooks would be millions of individual calls.
Find this in your dashboard
- Sign in and select the workspace and domain you want to manage.
- Open Statistics. Review the article’s steps and your plan’s available controls.
- Save your changes, reopen the record and verify the saved result. For routing changes, check the short link with a test visit.